Targets
Targets are used to establish usage goals and to verify improvement projects for organizations and sites. Manage your efficiency projects with Targets to determine if energy, water, cost, or carbon savings are being achieved.
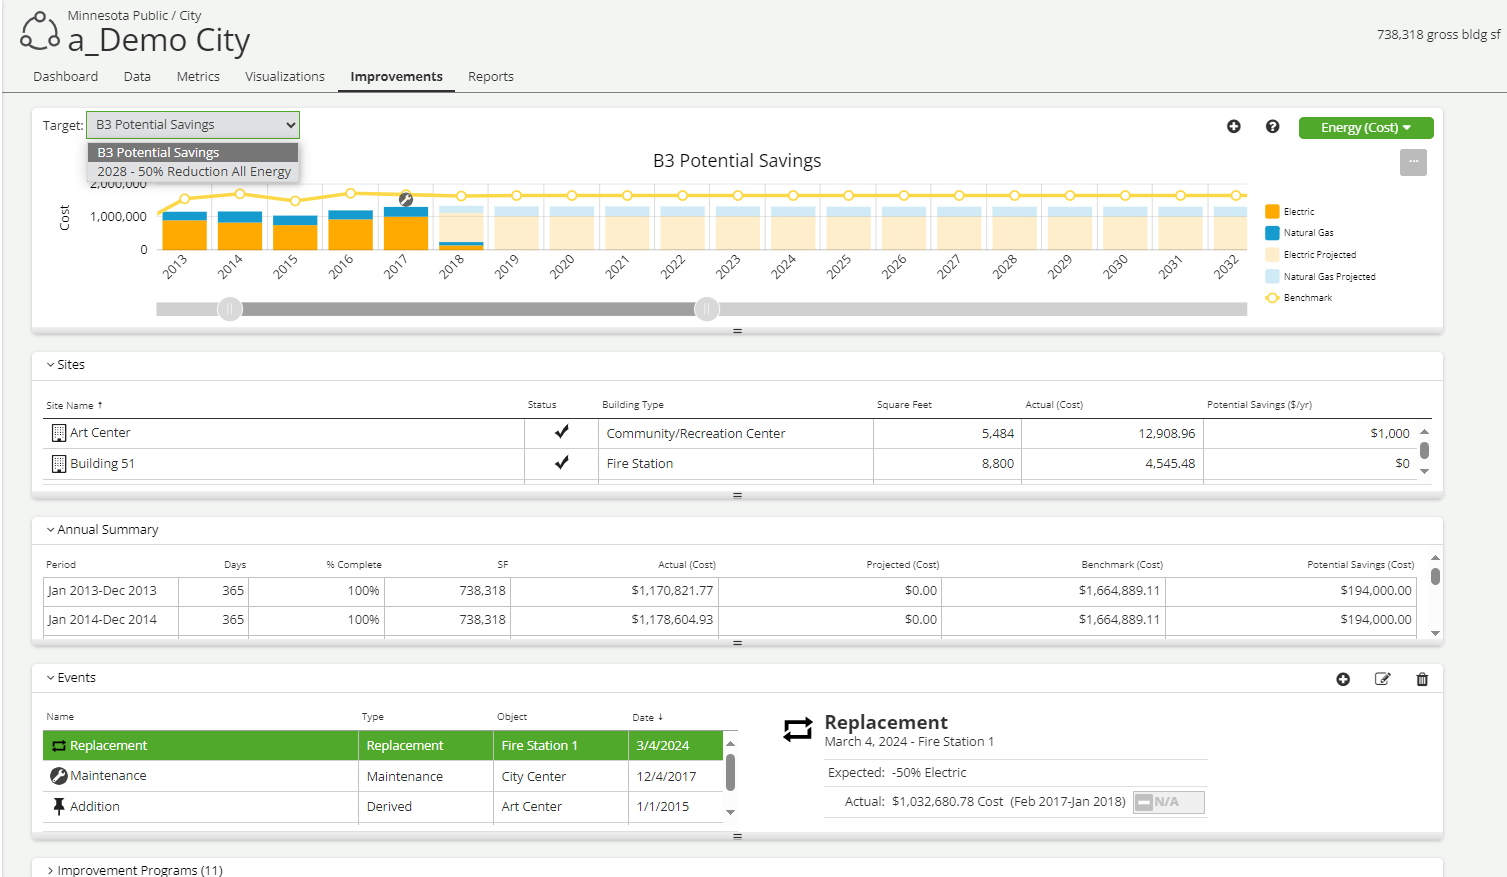
B3 Potential Savings is the default Target. Existing Targets are listed with the down arrow. You have the option to view, edit, or delete your Targets (B3 Potential Savings target cannot be edited).
New Target: To create a new Target, click on the + plus sign at far right of window to launch the Target Editor.
- Relative Target (set a baseline timeframe and your expected savings % and an achieve-by date (optional), describe your Target, note if it is an organizational or specific site Target. You can set a Target as default (replacing B3 Potential Savings.)
- Absolute Target (choose metric, frequency, and meter source type/unit. Then specify usage for the source, describe your Target, apply to organization or specific site, and choose Model (optional).
Projected data misc.:
- The Target graph goes as far back into the past as relevant (with usage data) to 2005 (no earlier). The graph goes 30 years into the future from today. The graph will be annual bars when you show 6 years or more. It will flip to monthly bars when viewing 6 years or less.
- Projected Usage and Cost will be constant/flat in terms of predicted usage into the next 30 years. Carbon Targets will be reflected differently as they are calculated on grid efficiencies/reduced carbon emissions based on eGRID Region.
- Targets will show previous usage and the most recent 12 months of data will be used to project future usage, costs, and carbon. As actual data is entered, the projections will adjust.
Events
Add Events to designate a happening that may have impacted the organization, site, building(s) and/or meter(s).
To create a new Event, click on the + plus sign at far right of Events window panels.
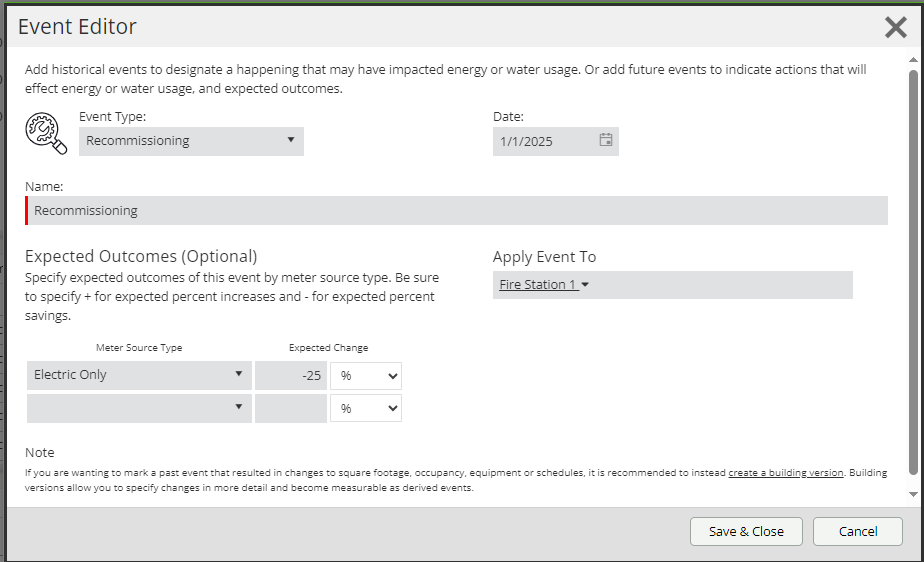
- Choose Event Type, date of occurrence if in the past or set a future date. A future date can be analyzed with Projected usage noted at any Target’s bar graph to help track if your Event’s expected outcome(s) will help you achieve your Target goals.
- Name your Event and set expected change (optional).
- At the Events table, click on an Event to see detail about the event.
- If past event: Baseline usage (time frame is 12 months prior to Event date), Expected (% or factor expected change if set), and Actual usage noting increase or decrease from baseline usage %.
- If future event: Expected (if expected change set) and Actual usage (most recent 12 months of data). Review Projected under Targets to see where your future event (with expected changes) affects meeting Target savings.
Events panel with Type: Derived, points to those Events that are system-generated i.e., Versions (including decommissioned) and Original Occupancy (if date is 2005 onward).
Sites
At the organizational level, sites will be listed with columns related to the selected Target.
If the Potential Savings target is chosen, potential savings will be shown for each site. For all other Targets, Actual, Projected, Target, and Percent Change from Target columns will be displayed.
Sites are sorted by worst performers at top of list by default, so they may be highlighted for efficiencies projects.Annual Summary
- The Annual Summary table provides data relevant to the selected Target and the timeframe selected in the chart.
- Columns adjust with the selected Target.
- Potential Savings column for Potential Savings Targets and change in Baseline and Target columns for other Targets.
- The Summary table totals savings for every year into the future, reflecting savings if no improvement projects were done.
Improvement Programs
Outside resources and expertise is sometimes needed to realize improvement projects. This list of state and national resources and programs may be of assistance. Click on a program name to find more information about getting involved.