B3 Overview
B3 Benchmarking is a cloud based online tool that collects, stores, manages, and analyzes usage data (energy and water) for sites and buildings. B3's algorithms go beyond statistical benchmarks and scoring to provide more insight on a wider range of buildings than using ENERGY STAR® Portfolio Manager® (ESPM) alone. B3 integrates with and expands upon ESPM, pairing usage data and basic building information with real-time energy simulations, providing analysis of carbon, energy costs, and energy use intensity (EUI) by month, fuel stream, and major end-use. Many of these same metrics are available for water use. Highlighted below are key aspects of B3 Benchmarking.
Dashboard
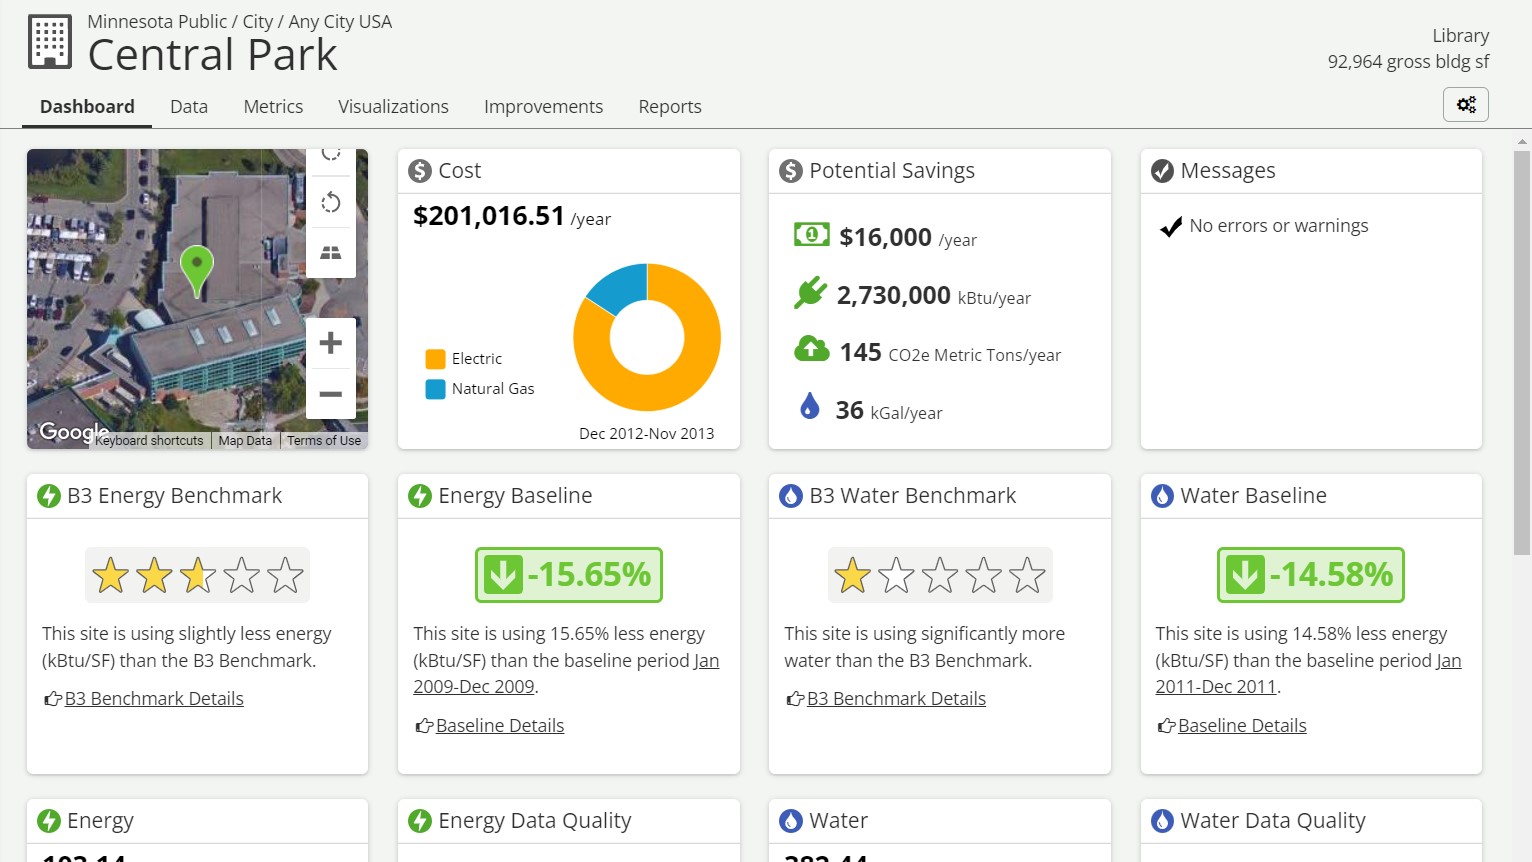
The landing page of B3 Benchmarking is a customizable dashboard. Each user's dashboard 'widgets' can be configured to highlight metrics most important to that user. That may be financials for a CFO, energy kBtu for an Energy Manager or a mix of both energy and water for a Sustainability Manager. B3 data is managed and viewed on two basic levels in B3 Benchmarking - Organization and Site. An organization, such as a city or company, can consist of one or more sites. Each site often includes one or more buildings that share at least one meter but may also be a non-building site. When meters are shared across buildings, individual building usage cannot be disaggregated. When a building does not share any meters with another building, it can stand alone on its own site.
Metrics
B3 Benchmarking provides the ability to manage existing building’s energy and/or water use with simple reports using a minimum of 12-months usage information (e.g. utility, interval or BAS) and some basic facility data about the building. Based on this information, B3 can then easily identify four key metrics.
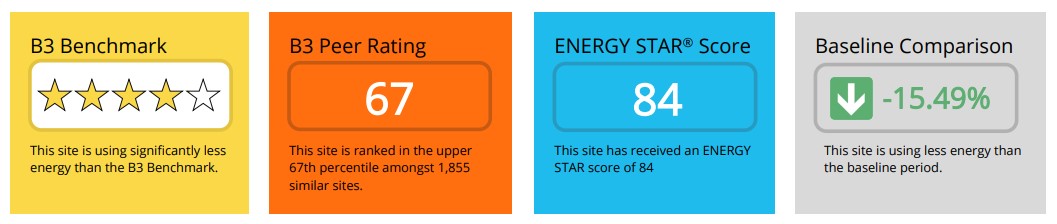
Each of these four B3 metrics are available for both energy and water. Energy metrics are highlighted green whereas water metrics are blue. Switching between the two ‘modes’ can be done via the dropdown in the upper right corner of the metrics panel. Knowing which building sites use more than expected identifies which buildings are cost-effective candidates for retro-commissioning or retrofit projects. And knowing which buildings are consuming more or less than in previous years allows you to know which buildings to focus attention on right away so you can determine what is required to maintain or improve its usage.
B3 Benchmark
The B3 Benchmark metric compares if the building is consuming more or less than expected. The Energy Benchmark uses an engineering model of the building, created from the facility data entered, to predict its energy usage as if it were built to the selected energy code. The Water Benchmark uses industry standard calculations, based on the facility data entered, to predict its water usage as if it were built to current building code. This predicted usage, the Benchmark, is compared to the entered actual usage in the form of the Index Ratio. Those buildings with higher ratios will yield the highest return on investment of funds spent on performance improvements. Of course, the more accurate the building data is, the more accurate the model and calculations will be.
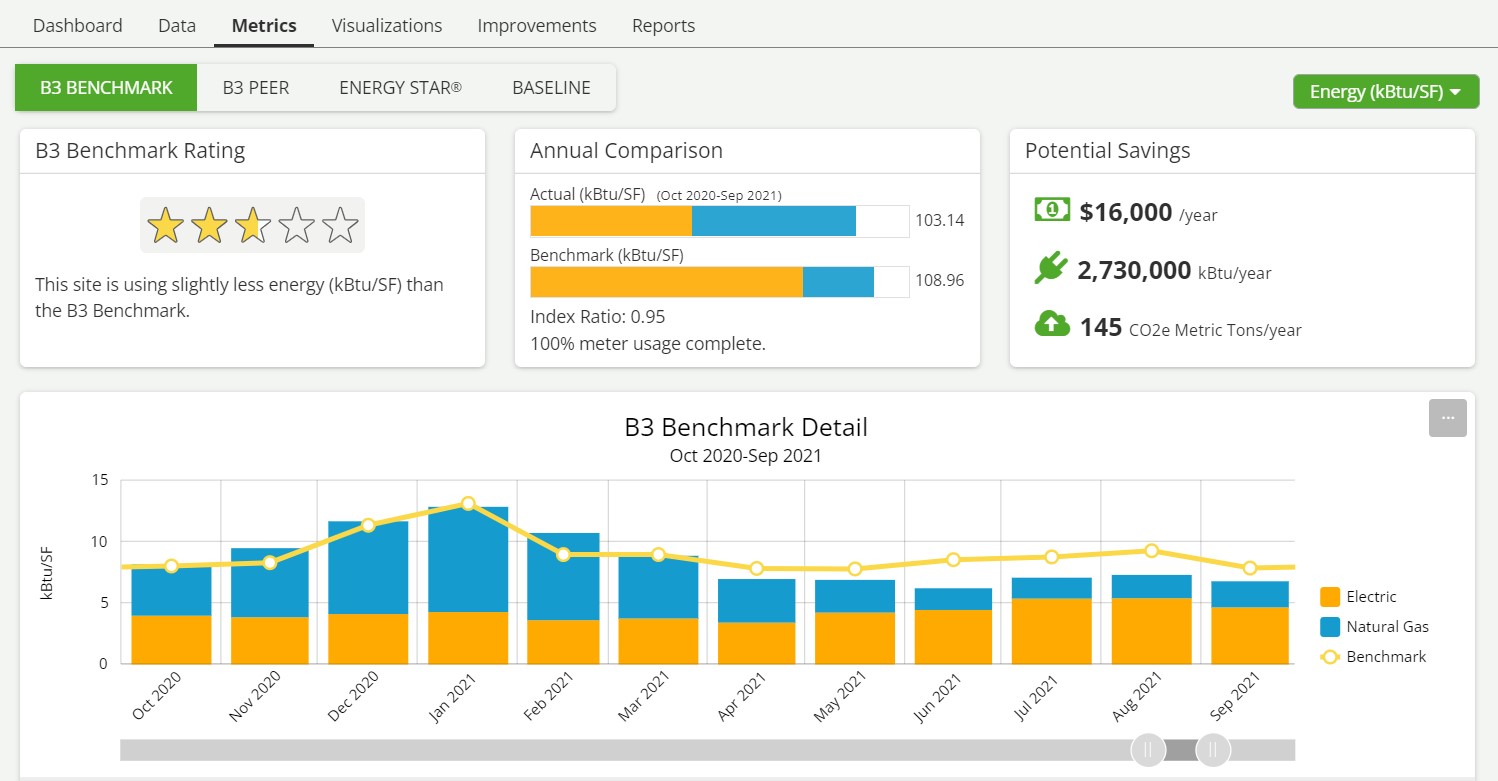
The top panel shows the site’s Benchmark Rating presented in the 5-star rating system, Annual Comparison of the actual to Benchmark, and any Potential Savings. In this example, the site is using 103.14 kBtu/SF. Dividing Actual usage by benchmark usage of 108.96 kBtu/SF results is an Index Ratio of 0.95 - meaning that the actual usage for the building is performing close to the code-based model predicted usage. The Potential Savings is calculated for each source so even though overall the building is using less than expected, there is potential for savings from one of the sources. In comparing the annual usage bars, the building is using far less electricity than the Benchmark, but the actual natural gas usage is more than the Benchmark natural gas usage resulting in potential savings.
The lower panel displays the monthly actual usage compared to the monthly Benchmark allowing analysis of seasonality. Benchmarking by source type is also available, which shows the expected use for each source type utilized by the building and helps inform decisions on potential improvement projects. For example, if the building is consistently using more electricity than expected by the benchmark model, a lighting retrofit or plug load reduction may provide efficiencies. Click the drop down in the upper right to filter by source type.
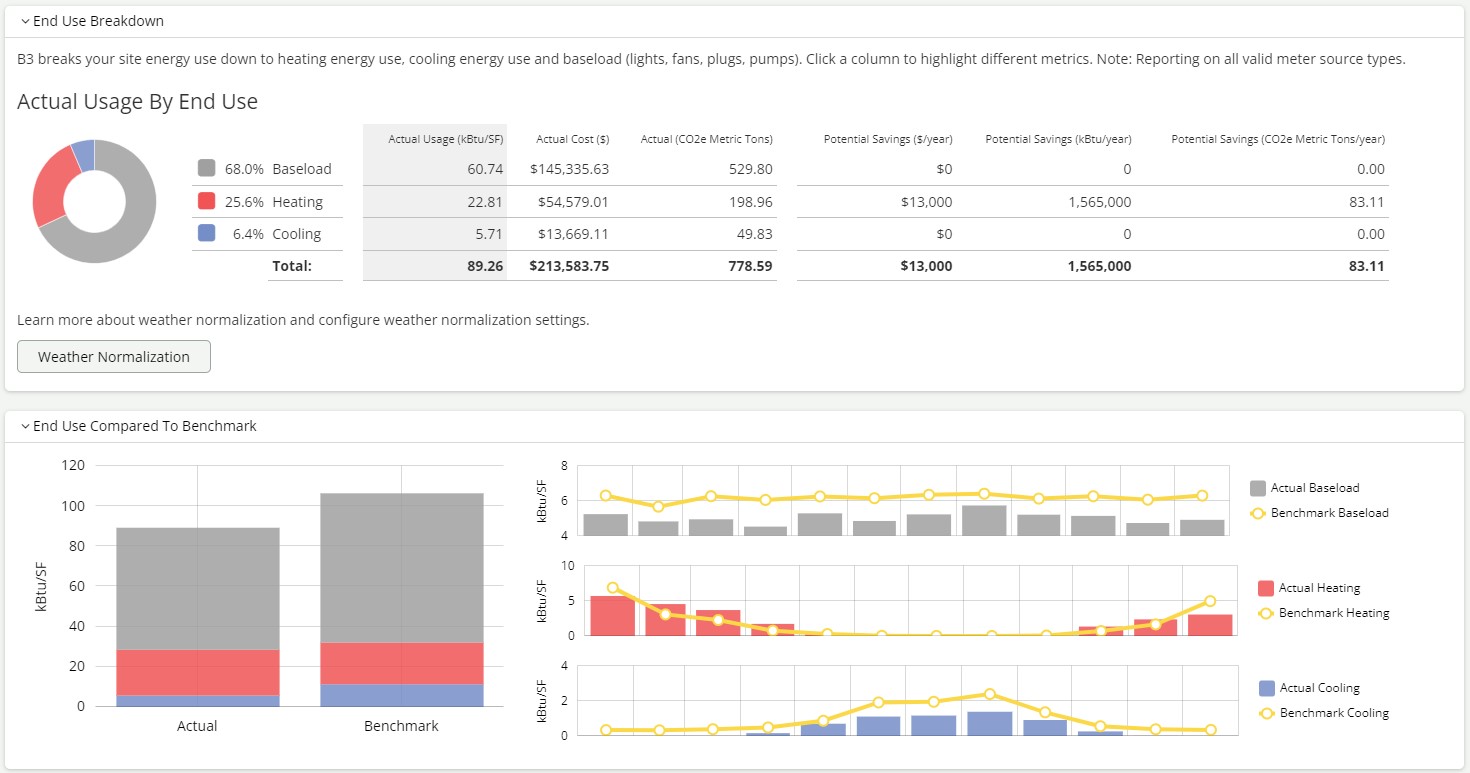
The lower portion of the B3 Benchmark metric compares the end use breakdowns (baseload, heating, and cooling) for a site. The top panel with the table breaks down the end uses by actual usage, costs and carbon emissions or the potential savings of usage, costs and carbon emissions. Clicking on a column will update the pie chart percentages.
The lower panel with the graphs compares each of the end uses to the expected benchmark use for that type at a monthly level. This allows building owners to see if potential savings are seasonal or throughout the years.
B3 Peer
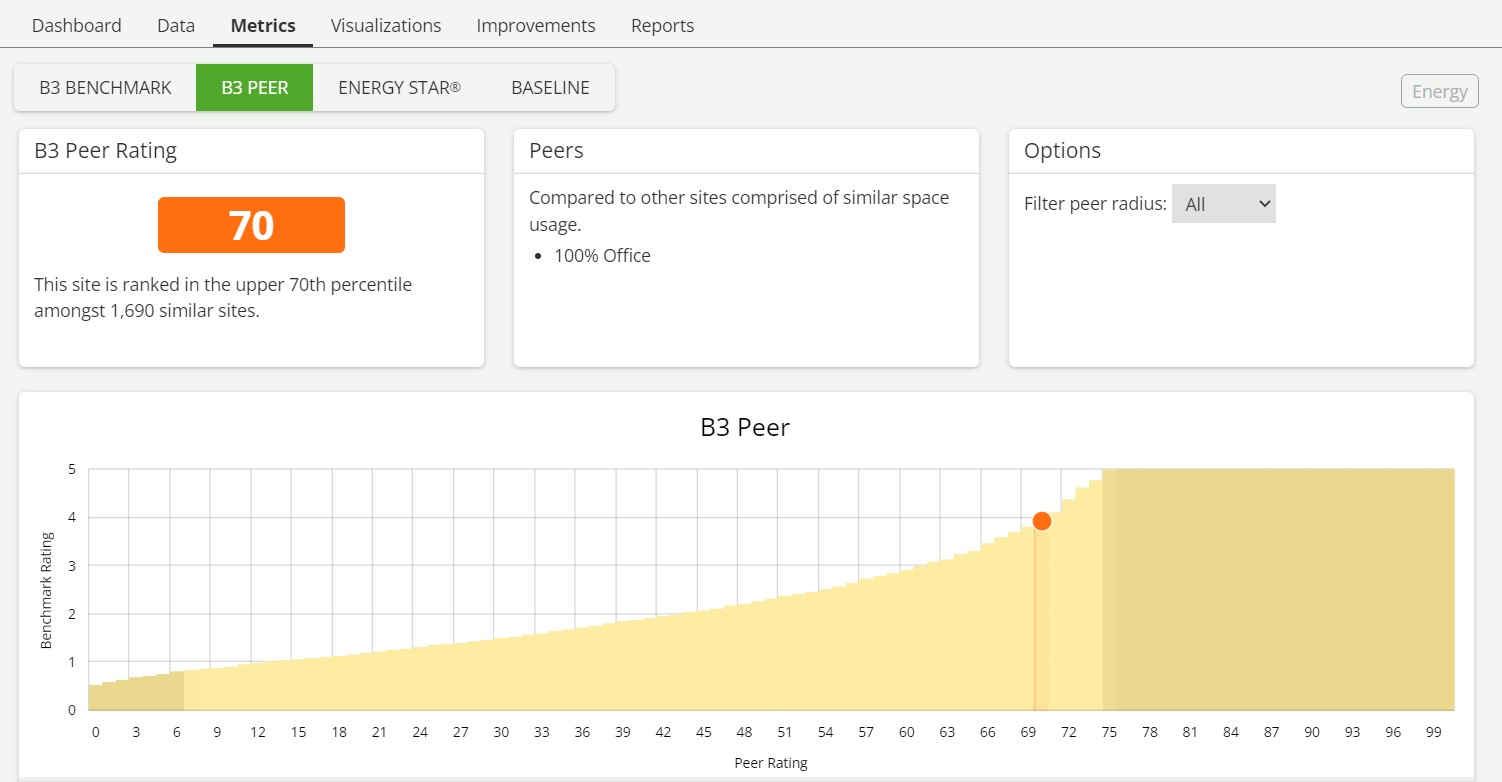
The B3 Peer metric compares if the building is consuming more or less than similar buildings in the B3 system. B3 will determine a building’s peers based on sites having the same space type usage or similar space type usage within a certain tolerance. If there are not enough similar sites, a peer comparison rating is not available. To compare sites of similar space type, B3 uses the Benchmark Index Ratio - which measures how buildings are performing relative to their expected usage. At a Site level, a graph is provided as a visual representation of the 1-100 ranking. The B3 Peer can be helpful in informing you that buildings may have potential for improvement based on the fact that similar buildings are using less than expected.
ENERGY STAR
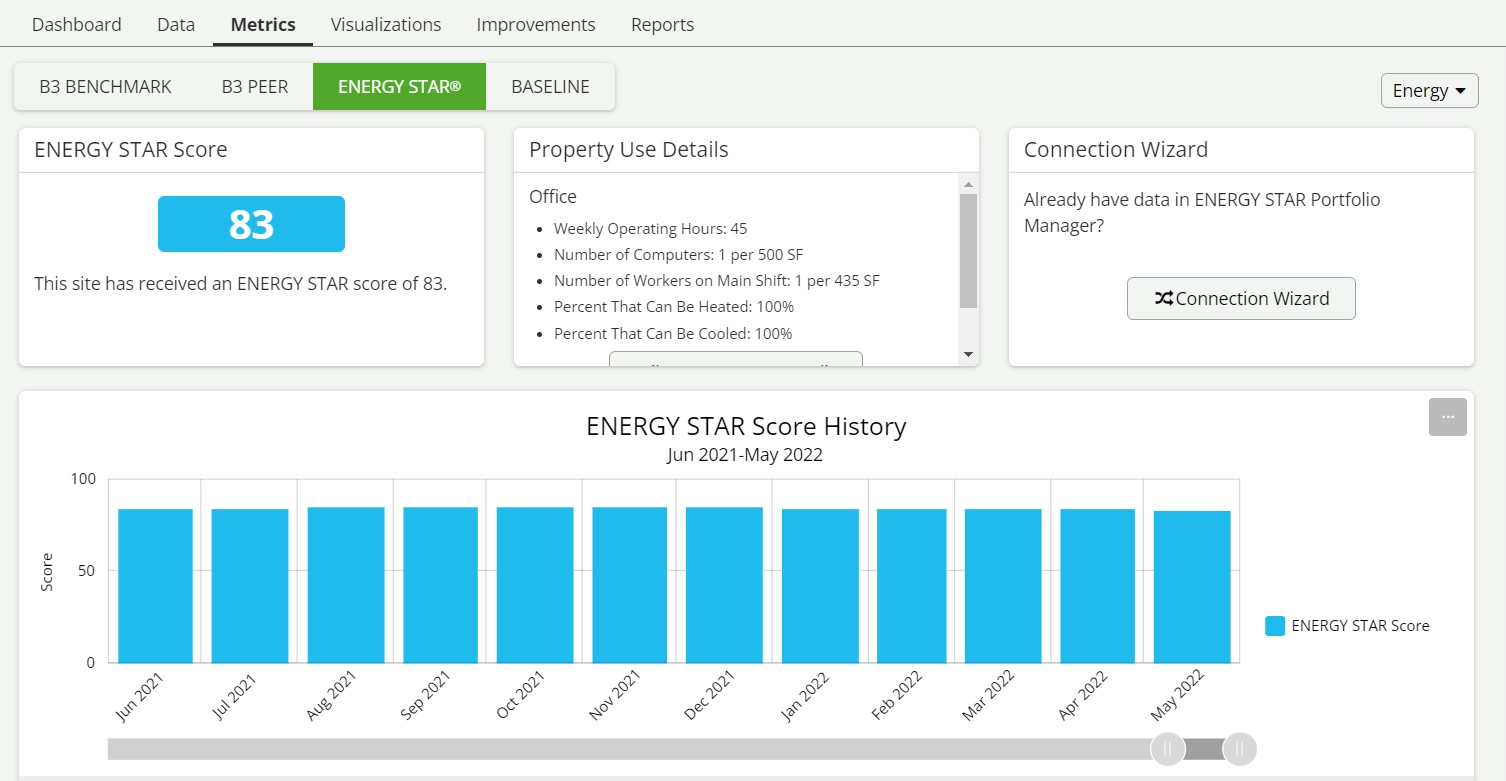
The ENERGY STAR metric compares if the building is consuming more or less than similar buildings nationwide using a statistical dataset. Not all building types are eligible for an ESPM energy score and even fewer are eligible for an ESPM water score. If a building is eligible, the ENERGY STAR 1-100 score will appear. If the site is ineligible, a description of the issue from ESPM will be provided. The most common reason for ineligibility is that a site contains more than 25% 'other' ENERGY STAR space usage.
![]()
Baseline
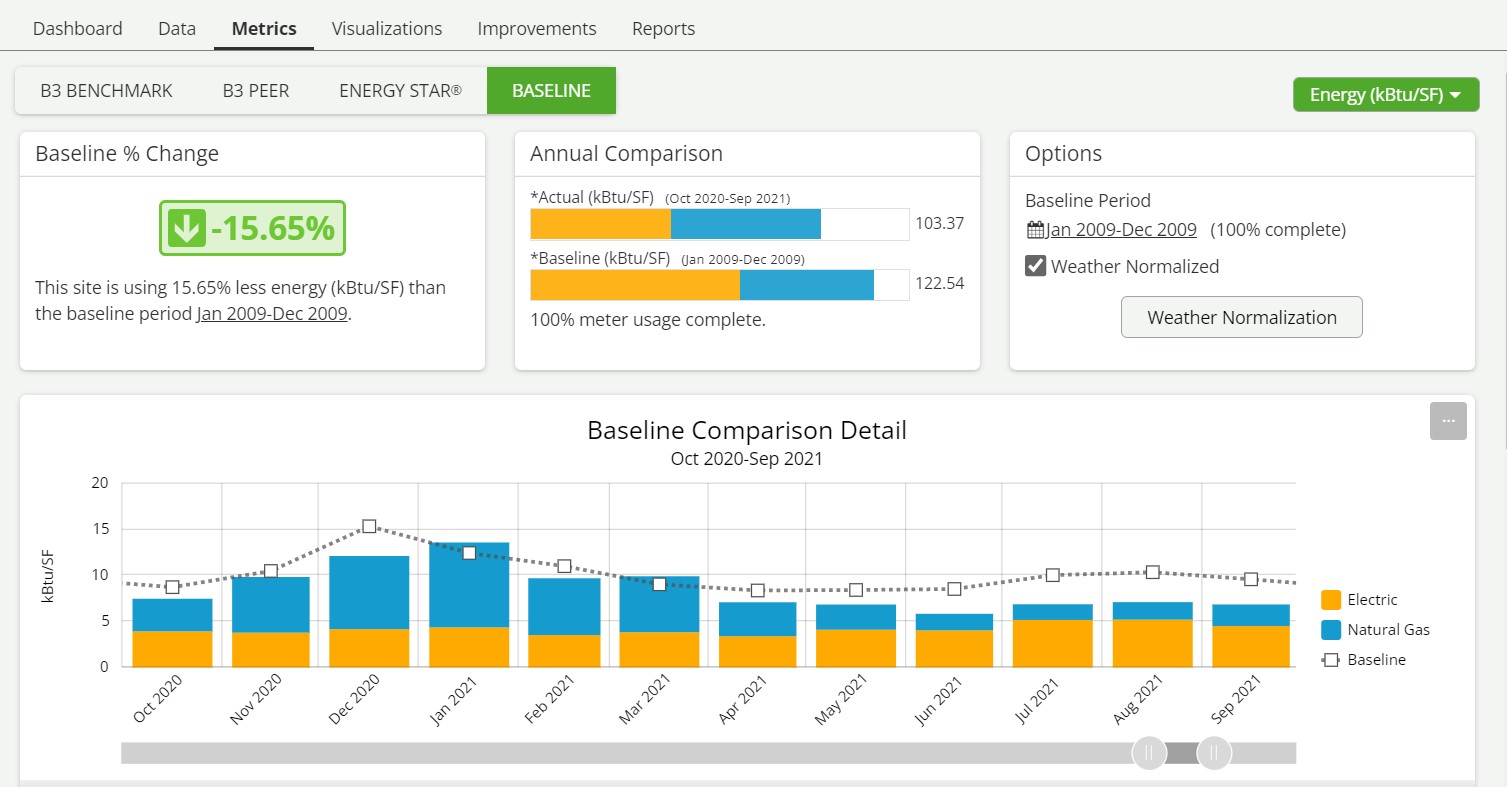
The Baseline metric compares if the building is consuming more or less than a previous 12-month period of the building’s own usage. Baseline comparisons can be weather normalized to remove the variable of weather from year to year allowing more of an apples-to-apples comparison. This allows the focus to be on factors of occupancy, operations and building system/component changes. Both the actual and baseline usage is adjusted to align with a 20-year average weather based on each site’s determined weather signatures. Baselines may be used to track savings from improvement projects and manage the site’s usage performance on an on-going basis.
The top panel shows the site’s overall % change comparing the most recent 12-months to the selected 12-month baseline period, Annual Comparison of actual to baseline, and options to update baseline period and view weather normalization details.
The lower panel displays the monthly usage compared the monthly baseline allowing analysis of seasonality. Baseline comparison by source type is also available, which shows the expected use for each source type utilized by the building and helps informs decisions on potential improvement projects. For example, if the building is using more electricity than the prior baseline period, a review of the system controls and schedules may provide insight into the increase. Click the drop down in the upper right to filter by source type.
Visualizations
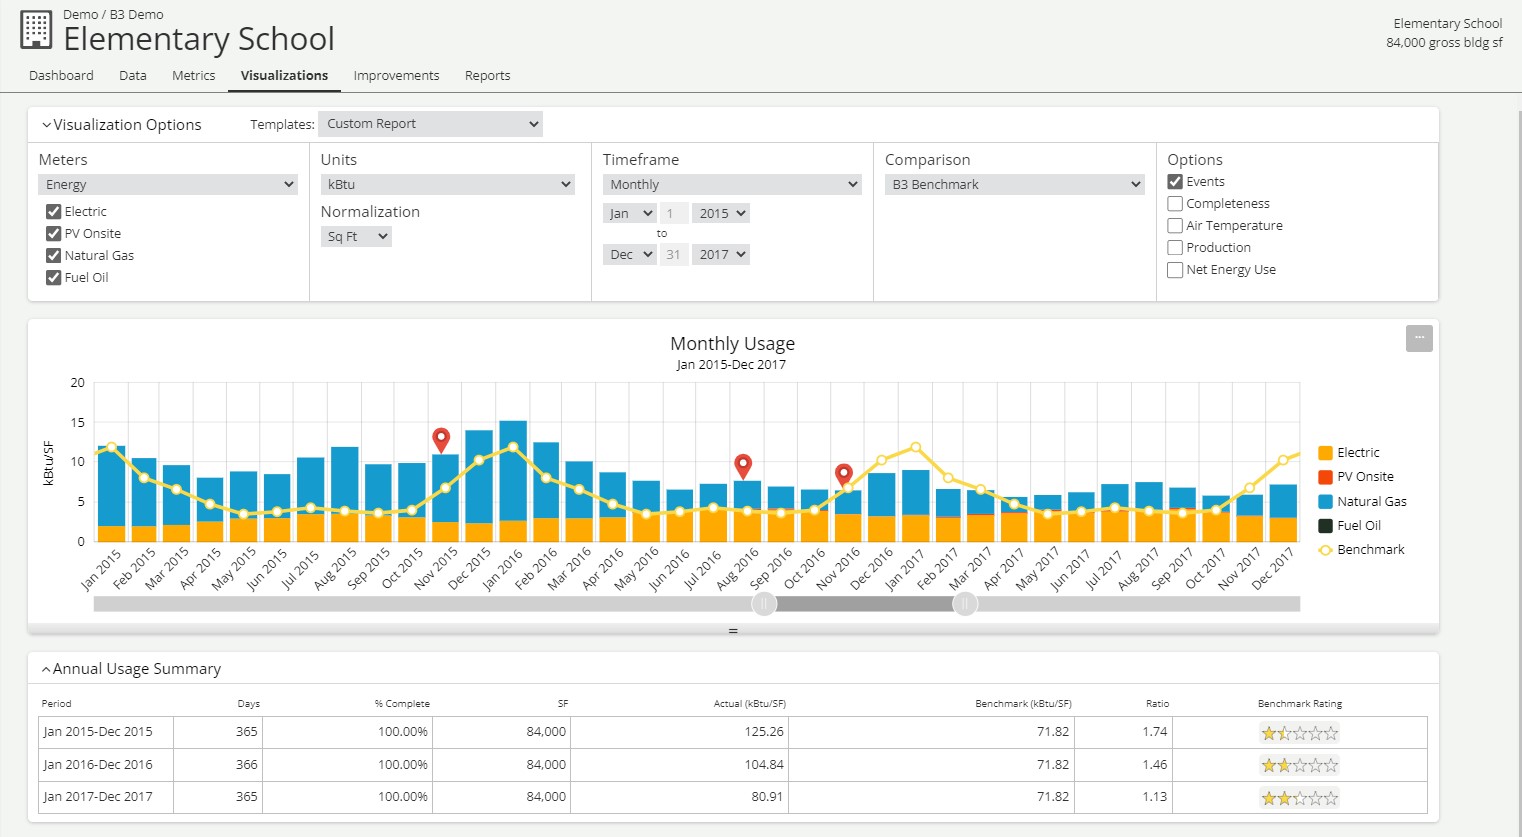
The Visualizations view allows you to graphically see the energy performance of an organization or a specific site for multiple time frames for all or some sources, in usage, costs, and carbon emissions for energy. The default template is the EUI Report; however, you may create various other views by expanding the options to select meters, units, timeframe and comparison metrics.
This example displays actual kBtu/SF for various energy sources as colored bars as compared to the predicted Benchmark usage as the yellow line. The site is using less than expected during the winter months but more in the summer months.
Improvements
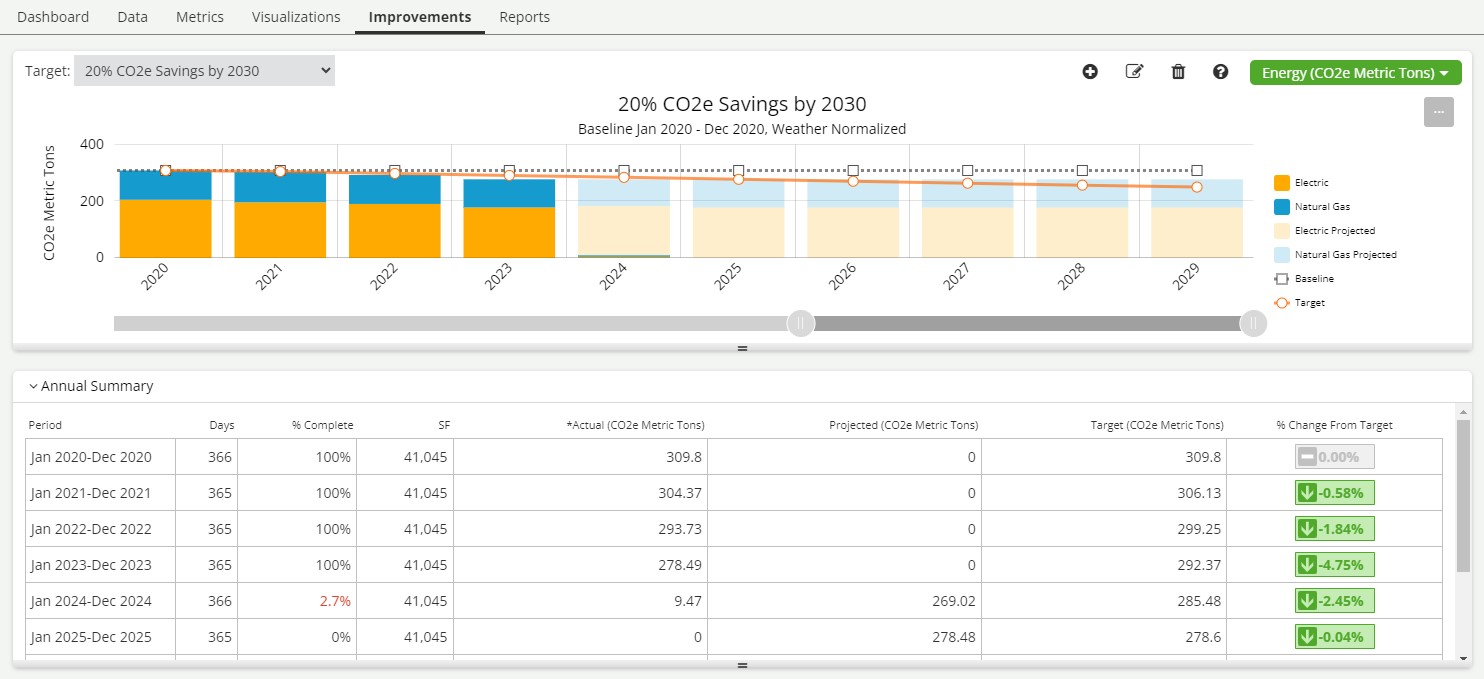
The Improvements view allows monitoring of actual usage to a set Target for an organization portfolio or specific site. Targets can be either relative or absolute, and defined by usage, costs or carbon. The graph also utilizes the most recent 12-months of actual data to provide future projections, helping analyze if an organization or site is on track to achieve the defined target. An example of a relative target would be a 20% CO2e savings by 2030 from a 2020 baseline. The site is currently on track but will begin to fall short in 2026. This informs building owners that additional efficiency measures will need to be taken. This is where tracking events can come into play.
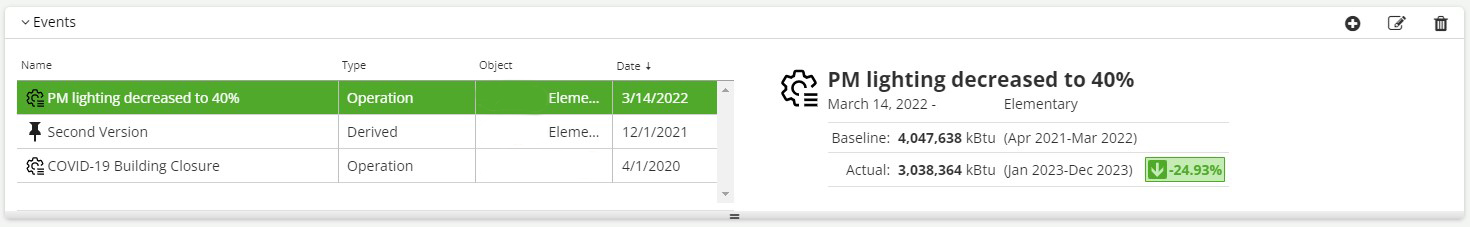
Events in B3 can be an unexpected occurrence that had an impact on usage or costs, like a broken water main. Or events can be efficiency measures that are anticipated to save usage, costs or carbon. Events can be entered as they occur or in the future to analyze anticipated impact on the future projections of usage, costs or carbon. Selecting an event will report on the percent change of the most recent 12-months compared to the 12-months prior to the event.
Data
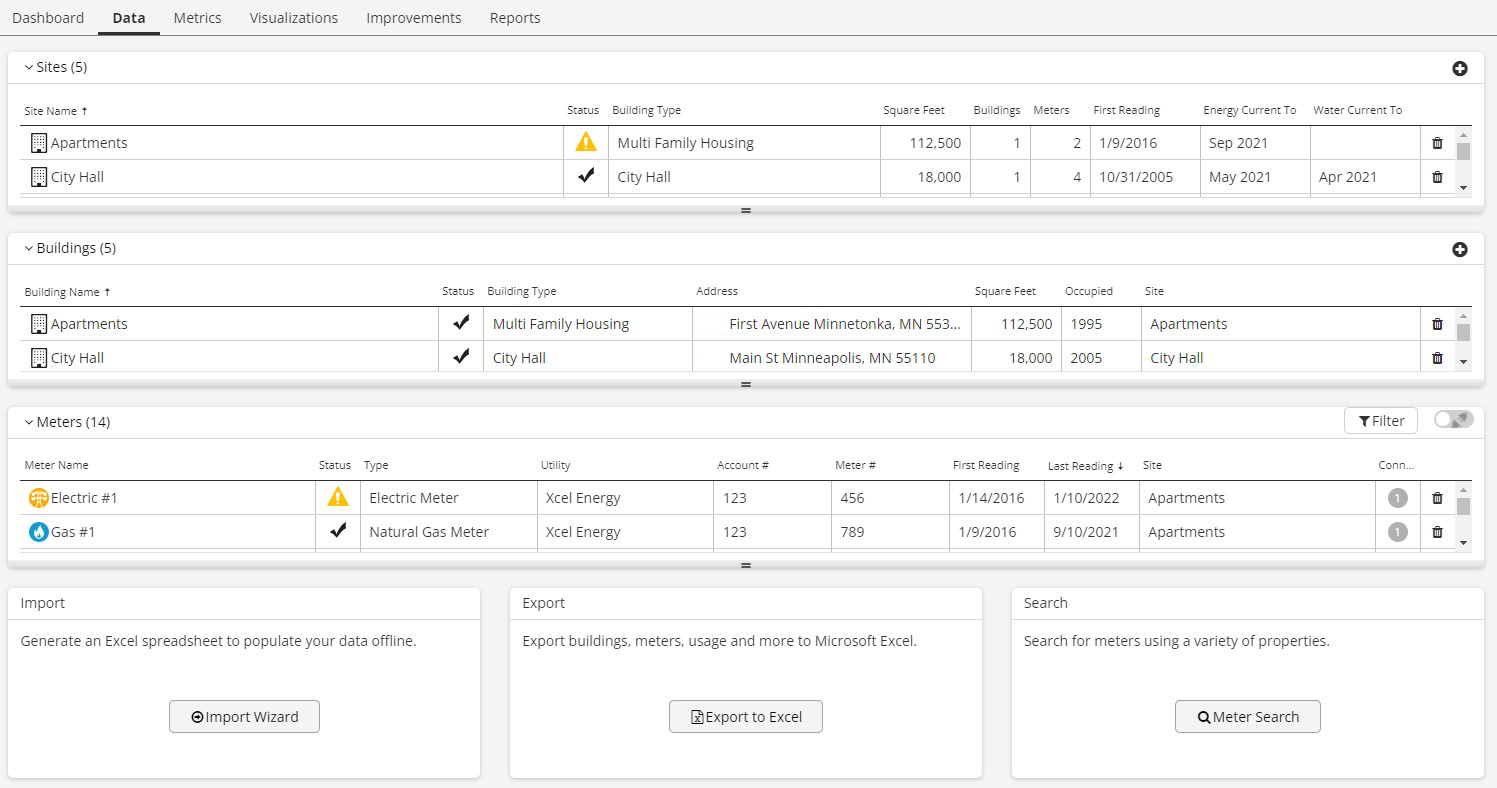
Data is where sites, buildings, and meters are managed. At each level, high-level attributes are provided as well as a status icon to alert if there are any warnings or errors noted with the data. Additional sites, buildings, meters can be added via the plus icon at the top right of each panel, or within the Tools menu in the upper right corner. Column headers can be clicked to resort the table. At the bottom of the Data tab, there are links to import data, link to ENERGY STAR Portfolio Manager, or search on specific meter properties. At the site level, the Data tab also provides a diagram view of the building(s) and meter(s) and how they are connected.
Sites and Buildings
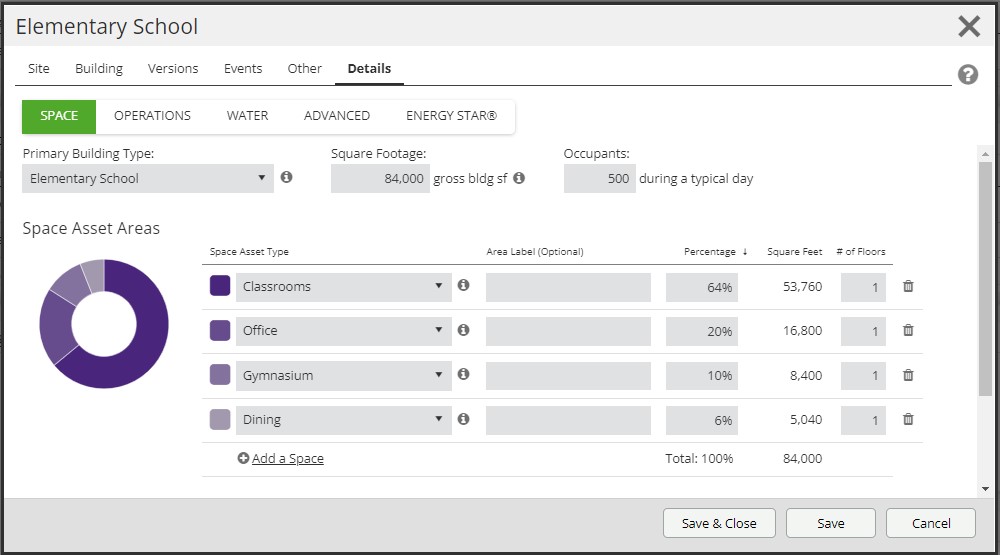
Most B3 sites contain one building thus the site and building editors are combined into one. Each building has a primary building type which provides a default set of space asset areas as well as default schedule and conditioning. Using these high-level defaults are a great place to get started. Taking it to the next level, the spaces within each building can be customized to align with how that specific building is allocated. Each space can then be defined for hours of occupancy and conditioning. For those that really know their buildings, the Advanced attributes can be defined to take the building to an even more granular level. The more accurate the building data entered, the more accurate the engineered model and thus the more accurate the Benchmark metrics.
Meters
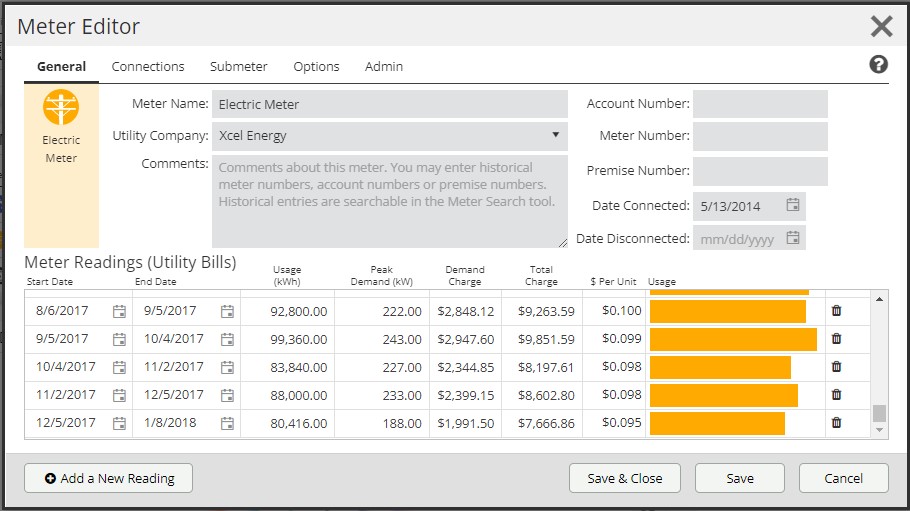
The Meter Editor provides a means to track attributes about each meter as well as enter ongoing usage data. Various different fields are available for the different meter types. In this example, the peak demand and demand charge columns have been enabled. For an onsite PV meter, it may be necessary to track production and kWh exported back to the grid.